Operating Systems Forensics
Introduction to Operating System Forensics
- Windows, Mac, and Linux are the three most widely used operating systems (OSs). Therefore, there is a very high chance that an investigator will encounter these Oss at the crime scene.
- Because OS forensics were not created with forensics compatibility in mind, it can be challenging for investigators to perform OS forensics to find the underlying evidence.
- To perform a successful digital forensic analysis on Windows, Mac, and Linux, one must be knowledgeable about how each operating system functions, including its tools and commands for extracting volatile and non-volatile data.

Windows Forensics
It is the process of identifying, preserving, analyzing, and presenting digital evidence from Microsoft Windows operating systems. Since Windows is the most widely used desktop OS globally, it is often the primary target in cybercrimes and digital investigations. Windows forensics involves examining system components such as the Windows Registry, Event Logs, file systems (like NTFS and FAT), Prefetch files, UserAssist entries, browser histories, memory dumps, and other artifacts that record user activity and system behaviour.
Investigators use this data to reconstruct events, determine the presence of malware, detect unauthorized access, and identify data breaches or exfiltration attempts. Due to the complex and constantly evolving nature of Windows OS, forensic professionals must be well-versed in its architecture and tools like FTK, EnCase, Magnet AXIOM, and various open-source utilities. Proper handling and interpretation of Windows artifacts are crucial to ensure the integrity and admissibility of digital evidence in legal proceedings.
Collecting Volatile Information
- Volatile information can be easily modified or lost when the system is shut down or restarted.
- Collecting volatile information helps to determine a logical timeline of the security incident and the responsible users.
- RAM, cache, and registers are where volatile data is stored.
Volatile information includes:
System time
- It gives details about the data collected during the investigation.
- It helps in re-creating the accurate timeline of events that occurred on the system.
- System uptime provides an idea of when an exploit attempt might have been successful. Command: date /t & time /t
Note: Acquire or duplicate the memory of the target system before extracting volatile data, as the commands used in the process can alter contents of media and make the proof legally invalid
Logged-on user(s)
- Collect information about users who are logged on to the system, both locally and remotely.
- Record all the complete details of a running process, the owner of a file, or the last access time on files.
- Tools and commands to determine logged-on-users
- net sessions: Controls the connections between server computers. When used without any options, net session shows details about all local computer sessions. It enables one to examine the usernames and computer names on a server, as well as if users have files open and how long their sessions have been idle.
- PsLoggedOn: It is an applet that displays the users who are logged on locally and through resources for a local or remote machine.
- LogonSessions: If the -P option is used, it displays the processes that are operating in each of the currently active login sessions.
Network information
- Hackers, after gaining access to a remote system, try to discover other nearby systems that are available on the network.
- The NetBIOS name table cache maintains a list of all the connections made to other systems using NetBIOS
- The NetBIOS name table cache can be viewed using the built-in windows command line tool nbtstat.
- The nbtstat -c option shows the contents of the NetBIOS name cache, which includes NetBIOS name-to-IP address mappings.
Open files
- Collect the information about the files opened by the hacker using remote login.
- Tools and commands used:
- Net file command: Displays details of open shared files on a server, such as name, ID, and the number of each file locks. It also closes individually shared files and removes file locks.
- PsFile utility: Command-line utility shows a list of remotely opened files on a system as well as allowing users to close the opened files either by name or by a file identifier (ID).
- Openfiles command: This command allows you to query, view, or disconnect files and directories that have been opened on a system. It also enables or disables the system Maintain Objects List global flag. Examples: openfiles /disconnect, openfiles /query, openfiles /local.
Network connections
Collect information about the network connections running to and from the victim system, this allows them to locate:
- Logged attacker
- IRCbot communication
- Worms logging into command-and-control server
Netstat with –ano switch displays details of the TCP and UDP network connections including listening ports, and the identifiers.
Netstat with the –r switch displays details of the routing table, and the frequent routes enabled on the system.
Network status
Collect information of the network interface cards (NICs) of a system to know whether the system is connected to a wireless access point and what IP address is being used.
Tools for the network status detection are:
- Ipconfig command
- PromiscDetect tool: PromiscDetect checks if network adapters are running in promiscuous mode, which may be a sign that a sniffer is running on computer
Process information
Investigate the processes running on a potentially compromised system and collect the information.
Tools and commands used to collect detailed process information include:
- Task Manager displays the programs, processes and services that are currently running on computer.
- Tasklist displays a list of applications and services with their Process ID (PID) for all tasks running on either a local or a remote computer.
- Pslist displays elementary information about all the processes running on a system.
- Pslist-x switch shows processes, memory information, and threads.
- Listdlls is a utility that lists all DLLs loaded in all processes, into a specific process, or to list the processes that have a particular DLL loaded.
- It displays information about open handles such as ports, registry keys, threads, and processes for any process.
Process memory
- Running processes could be suspicious or malicious in nature. Process Explorer program can be used to check if the process is malicious or suspicious.
- Process Explorer shows the information about open or loaded handles and DLLs processes.
- If the process is suspicious, it gathers more information by dumping the memory used by the process using tools such as PMDump, ProcDump, Process Dumper, etc.
- The tool comes with built-in support for cross checking if the process is malicious by scanning it across the virustotal’s malware database.
Shares
- Gets the information regarding the shared resources
- This information is maintained in a folder: HKEY_LOCAL_MACHINE\SYSTEM\CurrentControlSet\ Services\LanmanServer\Shares
Clipboard contents
- It is the memory area which stores the data for future use
- This data found in the clipboard can be used in a variety of cases such as information or intellectual property theft, fraud, or harassment.
Service or driver information
- When the system starts, services and drivers start automatically based on entries in the registry
- Users or system admins do not install all the services, some malware installs itself as a service or system driver
- Check service or driver information for any malicious program installed
Command history
- Use the doskey /history command to see previously typed commands
Collecting User Account Information
In a forensic investigation, user account details such the account name and type, logon timestamp, number of unsuccessful login attempts, and login location are important pieces of evidence. Information about user accounts is kept on windows systems in the Security Account Manager (SAM) file. Forensic investigators should go to the C:\Windows\System32\config\SAM directory to access the user account artifacts source file on a suspected windows computer.
Artifast
Artifast is a digital forensic solution that allows investigators to retrieve user account information from the suspected device’s image file. It parses user metadata in the SAM file and performs timeline analysis on them to help forensic investigators identify user accounts that were logged in to the suspected machine during the crime. It lists the existing user accounts, along with a pool of information such as the username, account type and status, login count, login scripts, path to the user profile folder, timestamp of last login, password reset, registry key modification, and failed login attempts. Furthermore, it allows forensic investigators to filter and sort the generated results using built-in and custom search filters.
Print spool files
- Print spooler is a software program for managing current print jobs.
- Create a temporary folder containing the print tasks with ‘.spl’ and ‘.shd’ extension files.
- The system deletes these files after completing the task.
- The temporary files can store print details such as owner, document, printer, printing processor – format, number of copies printed and the print method.
- The windows printing process supports two data types:
- RAW – .SPL file consists of data to be printed
- EMF – .SHD file consists of the metadata and can be printed on any printer
- By default, the path of .spl and .shd in windows is C:\Windows\System32\spool\PRINTERS.
- SPL and SHD files contain metadata stored as Unicode and require Unicode capable tools to explore: Hex editors.
Collecting Non-Volatile Information
- Non-volatile data remains unchanged when a system is shut down or is unable to find power.
- Example: Emails, word processing documents, spreadsheets and various “deleted” files.
- Such data usually resides in hard drive (swap file, slack space, unallocated space, etc.).
- Other non-volatile data sources include DVDs, USB drives, etc.
Examine File Systems
- Run the command dir /o:d in command prompt.
- Enables the investigator to examine:
- The time and date of the OS installation
- The service packs, patches, and subdirectories frequently update automatically. For example: drivers, etc.
- Give priority to recently dated files.
Registry Settings
- Several registry values and settings could affect the subsequent forensic analysis and investigation.
- It can be used to access and manage the Registry.
- Registry values that can greatly affect an investigation are the following:
ClearPageFileAtShutdown
- This registry value tells the operating system to delete the page file when the system is shut down.
- The information within the page file remains on the hard drive during the system shut down. This can be portions of IM conversations, decrypted passwords, and other strings and bits that might provide important clues in the investigation.
- It becomes more difficult to get that important information when the page file is cleared after shutdown.
DisableLastAccess
- In Windows 10, you can set the value of HKEY_LOCAL_MACHINE\ SYSTEM\CurrentControlSet\Control\ FileSystem\ NtfsDisableLastAcessUpdate key to 1 to disable updating of the last access times on files.
- On Windows 10, you can also run fsutil command in an elevated command prompt to query, enable, or disable “Last Access Time”.
AutoRuns
- Several Registry sections are referred as autostart locations since they provide the ability to automatically start applications.
- Applications can be launched automatically by locations when the user login in, when the system boots up, or when the user performs a particular activity.
- Collect the information from specific keys and values with the help of reg.exe tool or AutoRuns tool, as part of the first-response activities.
Event Logs
- Event logs can change rapidly depending on the configuration and audited events.
- Choose which data must be collected depending on the occurred instance.
- Use tools such as psloglist.exe to retrieve the event records.
- Copy the event log files (.evt files) themselves off the system.
ESE Database File
- Windows 10 comes with Microsoft Edge as default web browser. It uses the Extensible Storage Engine (ESE) database format to store browsing records, including history, cache, and cookies.
- The database stores tables – FileCleanup, Folder, ReadingList, RowId, MSysObjids, MSysObjects, FolderStash, MSysLocales, and MSysObjectsShadow.
- Common artifact locations of Microsoft Edge include:
- ESE database: \Users\user_name\AppData\Local\Packages\Microsoft.MicrosoftEdge_xxxxx\AC\MicrosoftEdge\User\ Default\DataStore\Data\nouser1\xxxxx\DBStore\spartan.eb.
Slack Space
- Slack space refers to the portions of a hard drive which may contain data either from a previously deleted file or unused by the currently allocated file
- Non-contiguous file allocation leaves more trailing clusters leaving more slack space
- The data residue in the slack space is retrieved by reading the complete cluster
- DriveSpy tool collects all the slack space in an entire partition into a file
Virtual Memory
- Virtual memory is a concept that, when implemented by a computer and its OS, allows programmers to use a large range of memory addresses for stored data.
- Virtual memory can be scanned to find out the hidden running processes.
- Use X-Ways Forensics tool to scan virtual memory.
Swap Space
- A swap space is a storage space on a hard disk used as the virtual memory extension of a computer’s RAM
- When the applications running on Linux machines use up the RAM memory, the inactive pages inside it move to the swap space to free up the memory
- The Slack space on a hard disk should be twice the physical RAM, if the RAM size is ≤ 2GB
- In case the physical RAM is more than 2GB, for instance 5 GB, the slack space on a hard disk should be 2 GB more than the Physical RAM, i.e., 5+2=7 GB
- Issue swapon -s command to view the swap space.
Hibernate files
- Hibernate file is the snapshot of the RAM data, created when the system hibernates
- Stored in HDD as hiberfil.sys
- Helps investigator to:
- Track the list of applications
- Find the local and remote authentication details
- To find more information on the investigation of Hibernation slack space
- Tools used to explore hiberfil.sys: Hex Editor and AccessData’s FTK.
Page Files
- sys is a virtual memory file used to expand the physical memory
- Stores inactive processes data and sensitive data such as User Ids, passwords, etc.
- Acts as a swap file to improve system performance
- Acquisition through special tools like rekallmaster, Disk Explorer, Forensic Toolkit
- The registry path for the page file is: HKEY_LOCAL_MACHINE\SYSTEM\ CurrentControlSet\Control\Session Manager\Memory Management
Windows Search Index
- The Windows Search index maintains a record of any document or application on a PC, including the contents of those files
- It maintains email messages, calendar events, contacts, and media files stored on the PC
- Use Passware Search Index Examiner, which makes all the data indexed by Windows Search accessible
- By default, Windows Search indexes only the contents of each user’s “Documents” and “Favorites” folders, the default mail store on the PC, and the public folder
Collecting Hidden Partition Information
- Hidden partition is a logical section of a disk which is not accessible to the operating system
- Hidden partition may contain files, folders, confidential data, or backups of the system
- Tools like find & mount help to collect the information from the hidden partition
- Partition Logic can create, delete, erase, format, defragment, resize, copy, and move partitions and modify their attributes.
Other Non-Volatile Information
Web Browser Cache
- It allows users to cache the contents of web pages locally to speed up future access to regularly visited sites
- Downloaded content remains on the hard drive until deleted
- Data remains in the unallocated space of the hard drive even after the cache is deleted
Cookies
- Cookies are small packages of data to track, validate, and maintain specific user information
- Cookies may have an expiration date at which the browser deletes them; cookies without an expiration date are deleted at the end of a user session
- Users may also delete cookie data. However, even after deleting cookies, data may remain in the unallocated space of the hard drive.
Temporary Files
- These files are created by a program where it cannot allocate enough memory for the tasks or when the program is working on a large set of data
- In general, when a program terminates, the temp files are deleted. However, some programs create temp files and leave them behind
Auditing Installed Applications
To audit installed applications in Windows, investigators can use system interfaces such as Windows Management Instrumentation (WMI) that can provide access to Windows components and system information, including software inventory data. By executing Windows Management Instrumentation Command-line (WMIC) commands, forensic investigators can extract information related to installed applications.
- Run the following command to display information about installed applications with details such as application name, version, and location: wmic product get name,version
- Run the following command to extract audit information into a CSV file:
- wmic product get name,version,installloaction /format:csv > c:\software_inventory.csv
Identifying System Updates
To view Windows system updates, investigators can use WMIC commands that display the details of update history, which contains the installation date, description, etc.
Investigators can execute the following command to view the updated history and look for suspicious activity for further investigation.
Command: wmic qfe list
Virtual Hard Disk
Virtual Hard Disk (VHD) is a file format that stores data in a single file and can be used as a hard disk for the virtual machine. ‘.vhd’ is the file extension for VHD
- Data in a mounted VHD is hard to track when un-mounted, the data can be tracked only by vice-versa process or using specific tools
- The un-mounted disk can be opened by mounting and encrypting the .vhd file using volume encryption tools. BitLocker is another file encrypting algorithms
- The file can also be searched by sorting the ‘.vhd’ file extension in the user’s image
- The investigator can check for the mounted VHD in Disk Management used by the suspects to hide files
Collecting Process Memory
- Collect the contents of process memory available in a RAM dump file
- exe tool allows dumping the contents of process memory without stopping the process
- Process Dumper (pd.exe) dumps the entire process space along with the additional metadata and the process environment to the console; it redirects the output to a file or a socket
- exe dumps any process without attaching a debugger and without terminating the process once the dump has been completed.
Inside the Registry
- An administrator can directly interact with the registry through any intermediary application, the most common are the GUI registry editors that come with Windows – regedit and regedt32
- There are five root folders in the Registry Editor:
- HKEY_CLASSES_ROOT
- This hive contains configuration information relating to which application is used to open various files on the system
- HKEY_CURRENT_USER
- It is the active, loaded user profile for the currently logged-on user
- HKEY_LOCAL_MACHINE
- This hive contains a vast array of configuration information for the system, including hardware settings and software settings
- Windows\System32\config\SYSTEM
- Windows\System32\config\SAM
- Windows\System32\config\SECURITY
- Windows\System32\config\SOFTWARE
- HKEY_USERS
- It contains all the actively loaded user profiles for that system
- Windows\System32\config\DEFAULT
- HKEY_CURRENT_CONFIG
- This hive contains the hardware profile the system uses at startup
- Registry paths are volatile and do not exist in files on the hard drive
- These hives are created during system startup and are not available during system shutdown
- HKEY_CLASSES_ROOT
Registry Analysis
- During a live response, much of the information retrieved and analyzed within the registry, and the complete data during post-mortem investigation
- ProDiscover tool can be used to access the registry during postmortem analysis
- Steps to obtain information using ProDiscover:
- Load the case into ProDiscover à Right-click the Windows directory in the Content View à Choose Add to Registry Viewer à AccessData Registry Viewer locates files and displays them on the Registry Viewer
System Information
- Click the File Explorer shortcut on the Taskbar to open This PC window, now right-click and choose Properties to see system information such as OS version, service pack level, computer name, etc.
- Other information about the system is stored in the CurrentControlSet, a volatile portion of the registry
- Find the computer name in the following key, in the ComputerName value:
- HKEY_LOCAL_MACHINE\SYSTEM\CurrentControlSet\Control\ComputerName\ActiveComputerName
- Find the time when the system was last shut down in the following key: HKEY_LOCAL_MACHINE\SYSTEM\ ControlSet001\Control\Windows
- Find the ProductName, CurrentBuildNumber, and CSDVersion in the following key: HKEY_LOCAL_MACHINE\SOFTWARE\Microsoft\ Windows NT\CurrentVersion.
TimeZone Information
- Find information about the time zone settings in the following key: HKEY_LOCAL_MACHINE\SYSTEM\ CurrentControlSet\ Control\TimeZoneInformation
- This information can be important for establishing an activity timeline on the system
- Use the ActiveTimeBias value from the TimeZoneInformation key to translate or normalize the times to other sources from the system, such as entries in log files
Shares
- Windows Vista,7, 8.1, and 10 create hidden administrative shares on a system, by default
- If a user creates an additional share, such as via the net share command, that share will appear in the following key located in the HKEY_LOCAL_MACHINE hive: SYSTEM\CurrentControlSet\ Services\LanmanServer\Shares
Startup Locations
- Startup locations within the registry are locations that allow applications to be launched without any interaction from the user
- On a live Windows 10 system, the msconfig command launches the System Configuration Utility
- Path for the autostart option: Start à type Run à press Enter à type msconfig à press Enter à System Configuration window appears, select the Startup tab and click Open Task Manager à Task Manager window appears displaying the Startup applications à Alternatively, you may right-click on Taskbar and select Task Manager à In the Task Manager window, click Startup tab.
User Login
When a user logs into a system, the following Registry keys are accessed and parsed so that the listed applications can be executed:
- HKEY_LOCAL_MACHINE\SOFTWARE \Microsoft\Windows\CurrentVersion\RunOnce
- HKEY_LOCAL_MACHINE\Software\Microsoft\Windows\CurrentVersion\Run
- HKEY_CURRENT_USER\Software\Microsoft\Windows\CurrentVersion\Run
- HKEY_CURRENT_USER\Software \Microsoft\Windows\CurrentVersion\RunOnce
Note: These keys are ignored if the system is started in Safe Mode.
User Activity
- Autostart Registry locations are accessed when the user performs any action, such as opening an application like Outlook or Microsoft Edge
- Look for malware in these locations:
- HKEY_LOCAL_MACHINE\SOFTWARE\Classes\exefile\ shell\open\command
- HKEY_CLASSES_ROOT\exefile\shell\open\Command
- Windows OS provides the ability to alert external functions when certain events occur on the system, such as a user logs on or off or the screensaver starts
- These notifications are handled by the Registry key:
- HKEY_LOCAL_MACHINE\SOFTWARE\Microsoft\WindowsNT\CurrentVersion\Winlogon\Notify
- Sort the sub-keys beneath Notify based on their LastWrite times and pay attention to the entries near to the date of the suspected incident
- Check for the entries that list DLLs in the DLLName value that have suspicious file version information or no file version information at all
Enumerating Autostart Registry Locations
- AutoRuns tool can be used to retrieve information from autostart locations in the registry on a live system
- AutoRuns retrieves entries from several registry keys and displays what it finds
- It will also retrieve the description and publisher from the executable file pointed at each registry value
Note: The script is not compatible with Windows 10
USB Removable Storage Devices
- When a USB device is connected to a Windows system, footprints or artifacts are left in the registry
- When the device is plugged in, the Plug and Play (PnP) Manager receives the event and queries the device descriptor in the firmware for device information
- The PnP Manager then uses this information to locate the appropriate driver for the device and, if necessary, loads that driver
- Once the device has been identified, a registry key is created beneath the following key:
- HKEY_LOCAL_MACHINE\SYSTEM\ CurrentControlSet\Enum\USBSTOR
- You can use USBDeview to view the contents of the device descriptor
Cache, Cookie and History Analysis: Mozilla Firefox
Mozilla Firefox – Cache, Cookies, and History are stored in the following system locations:
- Cache Location: C:\Users\\AppData\Local\Mozilla\Firefox\Profiles\ XXXXXXXX.default\cache2
- Cookies Location: C:\Users\\AppData\Roaming\Mozilla\Firefox\Profiles\XXXXXXXX.default\ cookies.sqlite
- History Location: C:\Users\\AppData\Roaming\Mozilla\Firefox\Profiles\XXXXXXXX.default\ places.sqlite
Analysis Tool: MZCacheView
- MZCacheView reads the cache folder of Firefox/Mozilla/Netscape Web browsers, and displays the list of all files currently stored in the cache
- It displays information such as URL, Content type, File size, Last modified time, Last fetched time, Expiration time, Fetch count, Server name, etc. for each cache file
Analysis Tool: MZCookiesView
- MZCookiesView displays the details of all cookies stored inside the cookies file (cookies.txt) in one table, and allows to save the cookies list into a text, HTML or XML file, delete unwanted cookies, and backup/restore the cookies file
Analysis Tool: MZHistoryView
- MZHistoryView reads the history data file (history.dat) of Firefox/Mozilla/Netscape Web browsers, and displays the list of all visited Web pages in the last days
- It displays information such as URL, first visit date, Last visit date, Visit counter, Referrer, Title, and Host name for each visited Web page
Cache, Cookie, and History Analysis: Google Chrome
Google Chrome – Cache, Cookies, and History are stored in the following system locations:
- History and Cookies Location: C:\Users\{user}\AppData\Local\Google\ Chrome\User Data\Default
- Cache Location: C:\Users\{user}\AppData\Local\Google\ Chrome\User Data\Default\Cache
Analysis Tool: ChromeCacheView
- ChromeCacheView is a small utility that reads the cache folder of Google Chrome Web browser, and displays the list of all files currently stored in the cache
- It displays information like URL, Content type, File size, Last accessed time, Expiration time, Server name, Server response, etc.
Analysis Tool: ChromeCookiesView
- ChromeCookiesView displays the list of all cookies stored by Google Chrome Web browser, and allows to export the cookies into a text/CSV/html/XML file
- It displays information such as Host Name, Path, Name, Value, Secure (Yes/No), HTTP Only Cookie (Yes/No), Last Accessed Time, Creation Time, and Expiration Time for each cookie
Analysis Tool: ChromeHistoryView
- ChromeHistoryView reads the history data file of Google Chrome Web browser, and displays the list of all visited Web pages in the last days
- It displays information such as URL, Title, Visit Date/Time, Number of visits, number of times that the user typed this address (Typed Count), Referrer, and Visit ID for each visited Web page
Cache, Cookie, and History Analysis: Microsoft Edge
Microsoft Edge – Cache, Cookies, and History are stored in the following system locations:
- Cache Location: C:\Users\Admin\AppData\Local\Microsoft\Windows\WebCache
- Cookies Location: C:\Users\Admin\AppData\Local\Packages\Microsoft.MicrosoftEdge_8wekyb3d8bbwe\AC\MicrosoftEdge\Cookies
- History Location: C:\Users\Admin\AppData\Local\Microsoft\Windows\History
Analysis Tool: IECacheView
IECacheView reads the cache folder of Internet Explorer, and displays the list of all files currently stored in the cache
Features
- IECacheView displays the list of cache files
- It allows you to filter the cache files by file type
- It allows you to view the cache files of another user or from another disk
- Selecting and copying the desired cache item in the clipboard is easy
Analysis Tool: IECookiesView
It allows us to:
- Select and delete the unwanted cookies
- Save the cookies to a readable text file
- Copy cookie information into the clipboard
- Automatically refresh the cookies list when a website sends you a cookie
- Display the cookies of other users and from other computers
- Open the IECookiesView utility directly from Internet Explorer toolbar
- Change the content of a cookie
- Block specific websites from using cookies
Analysis Tool: BrowsingHistoryView
- BrowsingHistoryView utility reads history data and displays the browsing history in one table
- It allows users to view the browsing history of all user profiles in a running system
- The information in the browsing history table includes Visited URL, Title, Visit Time, Visit Count, Web browser and User Profile
- Another specialty is the extraction of browsing history from external hard drive.
System Restore Points (Rp.log Files)
- log is the restore point log file located within the restore point (RPxx) directory
- It includes value indicating the type of restore point; a descriptive name for the restore point creation event, and the 64-bit FILETIME object indicating when the restore point was created
- Description of the restore point can be useful for information regarding the installation or removal of an application
- System restore points are created when applications and unsigned drivers are installed, when an auto update installation and a restore operation are performed
- Description of the event that caused the restore point creation is written in the rp.log file, it helps the investigator to notice the date when the application was installed or removed
Prefetch Files
- When a user installs an application, runs it, and deletes it, traces of that application can be found in Prefetch directory
- DWORD value at the offset 144 within the file corresponds to the number of times the application is launched
- DWORD value at the offset 120 within the file corresponds to the last time of the application run, this value is stored in UTC format
- Information from .pf file can be correlated with the Registry or Event Log information to determine who was logged on to the system, who was running which applications, etc.
Shortcut Files
- Shortcuts are files with the extension .lnk those are created and accessed by users
- Users can create shortcuts to applications, documents, folders, removable storage devices, and network shares
- Tools like AccessData’s Forensic Toolkit (FTK), Windows File Analyzer (WFA), and EnCase provide the ability to parse the contents of .lnk files to reveal information embedded within the files
- Shortcuts can provide information about files (or network shares) accessed by the user. They also provide information about devices that the user might have attached to the system
Understanding Metadata
- Metadata is data about data. It describes various characteristics of data, including when and by whom it was created, accessed, or modified
- Because it is not normally seen, users can inadvertently share confidential information when sending or providing files in electronic form
- Examples of metadata:
- Organization name
- Author name
- Computer name
- Network name
- Hidden text or cells
- Document versions
- Template information
- Personalized views
- Non-visible portions of embedded OLE objects
- It is important to collect metadata, as it provides information about the following:
- Hidden information about the document
- Hidden, deleted, or obscured data
- Correlated documents from different sources
- The investigator can use tools such as Metadata Assistant, Paraben P2 Commander, Metashield Analyzer, etc. to analyze metadata
Metadata in PDF Files
- Portable document format (PDF) files can also contain metadata such as name of the author, the date when file was created, and the application used to create the PDF file
- Often, the metadata can show that the PDF file was created on a Mac or that the PDF file was created by converting a Word document to PDF format
- You can use the Perl scripts pdfmeta.pl and pdfdmp.pl to extract metadata from PDF files
- To view PDF metadata, open it with Adobe Acrobat Reader in the File menu, click Properties…
Metadata in Word Documents
- Word documents are compound documents, based on Object Linking and Embedding (OLE) technology that defines the file structure
- Word documents can maintain not only past revisions but also a list of up to the last 10 authors to edit the file
- You can use the Perl scripts wmd.pl and oledmp.pl to list the OLE streams embedded in a Word document
- To view metadata in Word 2010, click on the File tab à Info option à Click Check for Issues à Inspect Document à Select the content to view and click the Inspect button
Metadata Analysis Tool: Metashield Analyzer
Metashield Analyzer is an online service that allows you to analyze the metadata contained in files
Understanding Events
- Some events are recorded by default and some audit configurations are maintained in the PolAdEvt Registry key
- The Registry key which maintains the Event log configuration: HKEY_LOCAL_MACHINE\ SYSTEM\CurrentControlSet\Services\Eventlog\<Event Log>
Linux Forensics

Shell Commands
Investigators can use Linux commands to gather necessary information from the system. Some of the useful commands include:
- Dmesg: Displays kernel ring buffers or information about device drivers loaded into the kernel Syntax: dmesg | grep -i eth0 (Displays hardware information of the Ethernet port eth0)
- Fsck: Stands for file system consistency check and helps to check and repair any file system Syntax: fsck –A (Checks all configured filesystems)
- Stat: Displays file or file system status syntax: stat [OPTION]… FILE…
- History: Lists the Bash’s log of the typed commands Syntax: history n (Lists the last n commands)
- Mount: Mounts a file system Syntax: mount -t type device dir (Requests kernel to attach the file system found on device of type type at the directory dir)
- Ps: Used to report the status of current process Syntax: ps –ef (Displays information about all the processes in the system)
- Pstree: Displays the processes on a system in the form of a tree Syntax: pstree –h (Highlights the current process and its ancestors)
- Grep: Searches for presence of text or an expression or pattern in files Syntax: grep -i jpg filelist.list (Looks for the pattern “jpg” in the list of files)
- Top: Displays system summary information as well as a list of processes or threads Linux kernel is currently managing Syntax: top -hv (Displays the library version and the usage prompt)
- Kill: Terminates the processes without logging out or rebooting the system Syntax: kill -9 0710 (Terminates the process with ID 0710 using the kill signal)
- File: Displays the type of data contained in a computer file Syntax: file * (Displays information about all the files present in the current dictionary)
- Su: Allows user to run a command with substitute user and group ID Syntax: su root (Ownership of the session is changed to root and needs password)
- Dd: Copies a file, converts and formats it according to the operands Syntax: dd [operand]
- ls: Lists directory contents Syntax: ls –R (list recursively directory tree)
- pgrep: Stands for “Process-ID Global Regular Expressions Print “, searches through the current processes and lists the process IDs which match the selection criteria to stdout Syntax: pgrep -u root sshd (Lists the processes called sshd and owned by root)
Collecting Volatile Data
- Run the netsat command to extract network information
- It displays network connections, routing tables, and several network interfaces (network interface controller or softwaredefined network interface) and network protocol statistics
- Run last -F command to see the users’ full login and logout times and dates of the system
- Run hostname command to see the system hostname
- Run ifconfig -a command to view the configuration of all network interfaces on the system
- Run lsof (list open files) command to list all open files and the active processes that opened them
- Run lsmod command that displays loaded modules
- Xclip is a command line interface to the X clipboard
- Run xclip -o to output the contents of the clipboard
- Run aureport command to see the summary report of audit daemon logs
- Run id command to determine the user ID for the specified username
- After that, run the ausearch command to track all the user events pertaining to that user ID
- Executable and Linking Format (ELF) is the main executable file format
- System stores shared libraries, kernel modules, and the kernel in ELF Format
- Run readelf command to analyze the headers and sections of ELF files
- Verify the contents of /var/spool/cron/and /etc/cron.daily to collect information about any scheduled tasks
- Acquire the command history from the .bash_history file
- Collect the current state data of a Linux system from the “/proc” directory
Other commands to gather useful information about the compromised system:
- Run cat /proc/version command to know Linux kernel version used in the OS
- Run cat /proc/sys/kernel/domainname command to know the domain name
- Run cat /proc/swaps command to see total and used swap size
- Run cat /proc/partitions command to see the list of disk partitions
- Run cat /proc/cpuinfo command to see details about the CPU on a machine
- Run cat /proc/self/mounts to view the count points and mounted external devices
- Run cat /proc/uptime to measure the computers working time
Collecting Non-Volatile Data
- View connections and shared files: Smbtree & Smbclient –L localhost
- Check for auto-start services: Ls /etc/rcl.d
- Review of recently modified files: Find /etc –type f –printf ‘%TY-&Tm-%TT %p\n’ | sort –r
- Collect Login and System Logs: Cat /var/log/kern.log
- Search for files with strange names in /dev directory: Rkhunter –check –rwo
- Check security settings of the system for anomalies: Chkrootkit
- Find the deleted files and associated data: Fls –d TtestRawImage.dd
- Use Linux Volume Manager (LVM) to detect unallocated partitions and files: Parted
Mac Forensics

Introduction to MAC Forensics
Mac forensics is a specialized branch of digital forensics focused on investigating Apple’s Macintosh systems running the macOS operating system. With the growing popularity and adoption of Mac devices in both personal and professional environments, they have become increasingly targeted by cybercriminals. macOS, built on a Unix-based architecture incorporating the Mach kernel and BSD components, presents unique challenges and opportunities for forensic investigators. Unlike Windows, macOS uses distinct file systems, directory structures, and logging mechanisms, which require investigators to have in-depth knowledge of system components, including logs, user activity, system configurations, and application data. Effective Mac forensics involves identifying, acquiring, analyzing, and interpreting digital evidence stored across various system locations to uncover unauthorized access, malware infections, or data exfiltration. As Mac threats become more sophisticated, mastering Mac forensic techniques is essential for accurate and efficient cybercrime investigations.
Timestamp:
- Help investigators to calculate the uptime of the system, correlate log events and build a timeline
- Provides important info such as creation, access, and modification times of any file
- Gathering timestamps of applications, services, events, and logs of the system
- Use the command line input stat to see the timestamp of any file
- Usage: stat [-FlLnqrsx] [-f format] [-t timefmt] [file …]
Application bundles:
- Special directories that store application data, hidden from the user
- Investigators can analyze these bundles to identify malware or other suspicious data
- Evaluate the executable codes to find if something is wrong with the application
Finder:
- Default Mac application that helps find specific files and folders
- Helps to sort in the required order
User account
- Gather the data related to all the user accounts such as user IDs, passwordpolicyoption, etc.
- Help to find guest and administrator users
- Location about the user account data is stored in a user Library folder: /Users/username/Library
- Collect information such as access, modification, and creation for each account
Analyze file systems
- MAC OS uses the HFS+ file system, whose header stores file system data, such as allocation block size, volume, creation timestamp, and the location
- It has a header of 1024 bytes and allocation blocks, each with size of 4K bytes
- Comprises data streams called forks, which include data fork and resource forks
- Data fork stores file content, while resource fork consists of file information
Basic Security Module (BSM)
- Saves file information and related events using a token, which has binary structure
- The token represents specific data, such as arguments of the program, return value, text data, socket, execution, action in a file,
- Data stored in BSM helps to determine file type, creator, and usage data
Spotlight
- An integrated search technology that helps users to search for specific keywords within files
- Finds any known suspicious files and applications
- Use a spotlight to search for specific keywords that represent malice.
Time machine
- It is a backup tool that stores hard disk contents
- Comprises BackupAlias file containing information, in a binary format, about the hard disk used to store the backups
Home directory
- Stores the authentication data, such as logon attempts both success and failure of all users
- Help investigators in determining all the attempts made to bypass security along with the timestamps
- Also stores application and installation folders
- Other files include desktop, documents, library, magazines, etc.
Kexts
- MAC OS can load additional capabilities by loading kernel extensions
- Analyze the system for kernel extensions
Apple Mail
- The default email application with multiple POP3 and IMAP account support and advanced filtering
- Stores user email in the directory: /Users//Library/Mail
- Stores email in emlx format, where each email is its own file in ASCII format
- Use email extractors such as Email Extractor 7, Data Extractor, etc.
Instant Messegers
- MAC comes with default IM application iChat, which does not store previous conversations, but users can choose to save them manually
- Check for any saved chats in the default location: /Users//Documents/iChats
- The individual applications are stored as on at. ichat
Web browsers
- Safari is the default browser on a Mac system
- Information such as browsing history, download history, and bookmarks can assist as evidence and is stored as plist, Downloads.plist, and Bookmarks.plist respectively in the /Users//Library/Safari location.
Command line inputs
- MAC OS records commands in bash shell and stores them in the file .bash_history
- Use the command $tail .bash_history to view the last commands.
Property list or plist
- Mac OS store user settings in the form of Property List Format file (plist file)
- Stores set data in the form of Core Foundation types including CFString, CFNumber, CFBoolean, CFDate, CFData, CFArray and CFDictionary
- Uses XML or binary data format to store data.
Keychain
- Built-in password manager that saves the credentials for websites, wireless networks, SSH servers, private keys,
- Stores the credentials in an encrypted (3DES) container that can unlock only with the master password
- Can store sensitive information required for investigation
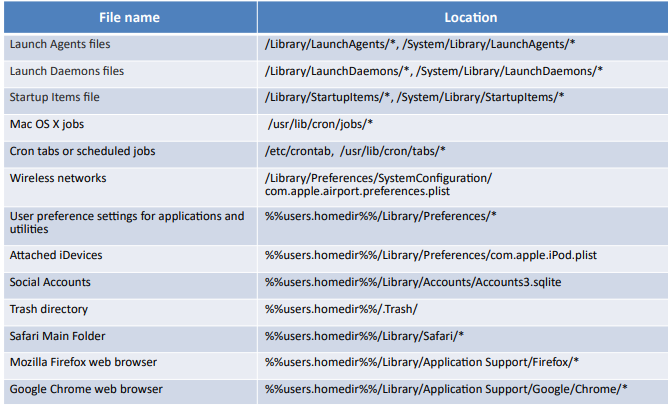
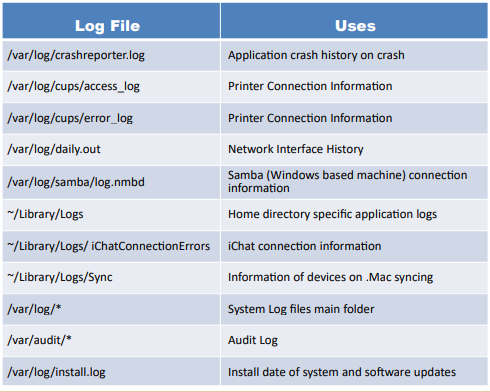
Mac Log Files
MAC Directories