Network Forensics
Network Forensics
- Network forensics is the gathering, documenting, and analysis of network event to discover the source of security issues.
- Capturing network traffic over a network is simple in theory, but relatively complex in practice; because of the large amount of data that flows through a network and the complex nature of the Internet protocols
- It is not practicable to record all the data moving over the network dur to the high resource requirements of recording network traffic.
- Further, an investigator needs to back up these recorded data to free up recording media and preserve the data for future analysis.

Network forensics can reveal the following information:
- Source of security incidents
- The intrusion route
- The Intrusion techniques an attacker used
- Traces and evidence
Postmortem and Real-Time Analysis
Forensic examination of logs is divided into two categories:
- Postmortem: Forensic Examination of Logs Postmortem of logs is done for the investigation of something that has already occurred.
- Real-Time Analysis: Real-Time analysis is done for the ongoing process.
Note: Practically, IDS is the real-time analysis, whereas the forensic examination is post-mortem.
Network Vulnerabilities
- Internal Network Vulnerabilities: These vulnerabilities occur due to the excessive bandwidth and bottlenecks.
- External Network Vulnerabilities: These vulnerabilities occur due to the threats such as DoS/DDoS attacks and network data interception.
Network Attacks
Most common attacks launched against networks:
- Eavesdropping
- Data Modification
- IP Address Spoofing
- Denial of Service Attack
- Man-in-the-Middle Attack
- Packet Sniffing
- Session Hijacking
- Buffer Overflow
- Email Infection
- Malware attacks
- Password-based attacks
- Router Attacks
Attacks specific to wireless networks:
- Rogue Access Point Attack
- Client Mis-association
- Misconfigured Access Point Attack
- Unauthorized Association
- HoneySpot Access Point Attack
- AP MAC Spoofing
- Jamming Signal Attack
Where to Look for Evidence
Logs collected in the network devices and applications can be used as evidence for investigating network security incidents.
Layers
- Application Layer
- Transport Layer
- Internet Layer
- Network Access Layer
Protocols
- File Transfer (TFTP, FTP, NFS), Email (SMTP), Network Management (SNMP), Name Management (DNS)
- Transmission Control Protocol (TCP) and User Datagram Protocol (UDP)
- Internet Protocol (IP), Internet Control Message Protocol (ICMP), Address Resolution Protocol (ARP)
- Ethernet, Fast Ethernet, SLIP, PPP, FDDI, ATM, Frame Relay, SMDS, ARP, Proxy ARP, RARP
Network Devices and Applications
- Servers/Desktops, Anti-virus, Business Applications, Databases
- Firewall, IDS/IPS
- Firewall, IDS/IPS, VPN
- Routers and Switches
Log Files as Evidence
- Log files are the primary records of user’s activity on a system or a network.
- Investigators use these logs to recover any services altered and discover the source of illegal activities.
- The basic problem with logs is that they can be altered easily. An attacker can easily insert false entries into log files.
- Computer records are not normally admissible as evidence; they must meet certain criteria to be admitted at all.
- The prosecution must present appropriate testimony to show that logs are accurate, reliable, and fully intact.
Laws and Regulations
Organization’s requirements for log management are outlined in the following rules, guidelines, and standards:
Federal Information Security Management Act of 2002 (FISMA) à Gramm-LeachBliley Act (GLBA) à Health Insurance Portability and Accountability Act of 1996 (HIPAA) à Payment Card Industry Data Security Standard (PCI DSS) à Sarbanes-Oxley Act (SOX) of 2002
Legality of using Logs
Organizations and investigators need to be aware of the following legal concerns while creating and utilizing logs:
- Logs must be created at least as soon as possible after the incident being investigated.
- Log files must be set immutable on the system to prevent any tampering.
- The information must be recorded by someone who knows about the event.
- Since a program is handling the recording in this instance, the records represent the programmer’s and system administrator’s past knowledge.
- Logs must be kept as a regular business practice.
- Random compilations of data are not acceptable.
- The business documents exemption does not apply to logs created after an incident has started.
- Keep regular logs to use them as evidence in future.
Event Correlation
- Event correlation is the process of connecting a set of events that took place within a specified time frame.
- The process includes analysis of the events to know how it could add up to become a bigger event.
- It usually occurs on the log management platform, after the users find certain logs having similar properties.
- In general, the event correlation process is implemented with the help of simple event correlator software.
Types of Event Correlation
Same-Platform Correlation
- This correlation method is used when one common Operating System is used throughout the network in an organization.
- eg., an organization running Microsoft Windows OS for all their servers may be required to collect event log entries, do trend analysis diagonally
Cross-Platform Correlation
- This correlation method is used when different Operating System and network hardware platforms are used throughout the network in an organization.
- eg., clients may use Microsoft Windows, yet they use a Linuxbased firewall and email gateway.
Prerequisites of Event Correlation
Transmission of Data
- Transmitting data from one security device to another until it reaches a consolidation point in the automated system.
- To have a secure transmission and to reduce the risk of exposure during data transmission, the data must be encrypted and authenticated.
Normalization
- Following collection, the data needs to be transformed once more from several log formats into a single or polymorphic log that is simple to add to the database.
Data Reduction
- After collecting the data, duplicate data must be removed so that the data can be correlated more efficiently.
- Removing unnecessary data can be done by compressing the data, deleting duplicate data, filtering or combining similar events into a single event and sending that to the correlation engine.
Time (Clock Time) or Role-based Approach
- This method is used to monitor the computer’s and computer user’s behaviour and provide an alert if something unusual is discovered.
Route Correlation
- This method is used to extract the attack route information and use that information to single out other attack data.
Steps to ensure log file accuracy:
- Log Everything
- Keep Time
- Use Multiple Sensors
- Avoid Missing Logs
Log Everything
- Do not consider any field in log files as less important, as every field can play a major role as evidence.
- Network administrators should always configure the server logs settings to capture every information available.
- g.: Configure IIS logs to record web user information about the Web to gather clues about the attack origin either a logged-in user or external system
- Consider a defendant who claims a hacker had attacked his system and installed a back-door proxy server on his computer. The attacker then used the back-door proxy to attack other systems. In such a case, how does an investigator prove that the traffic came from a specific user’s Web browser or that it was a proxied attack from someone else?
Keeping Time
- With the Windows time service, a network administrator can synchronize standalone servers to an external time source.
- If you use a domain, the Time Service will automatically be synchronized to the domain controller.
Why Synchronize Computer Times?
- When an administrator is investigating intrusion and security events that involve multiple computers, it is essential to synchronize the computer’s clocks.
- If computer’s clocks are not synchronized, it becomes almost impossible to accurately correlate actions that are logged on different computers.
- If the clocks on these computers are not accurate, it also becomes difficult to correlate logged activities with outside actions.
What is Network Time Protocol (NTP)?
- It is an Internet standard protocol used to synchronize the clocks of client computers and is based on TCP/IP.
- NTP sends time requests to known servers and obtains server time stamps. Using those stamps, it modifies the client’s time.
Features of NTP:
- It synchronizes accuracy up to one millisecond
- It can be used to synchronize all computers in a network
- It uses UTC time
- It is available for every type of computer
Using Multiple Sensors
- Use multiple sensors (firewall, IDS, etc.) to capture logs. This helps to prove the log credibility if two separate devices record the same information.
- Also, combining logs from different devices can increase the value of each
E.g.: Logs from Firewall, IDS, IPS may be helpful to prove that a system with a particular IP address has accessed a specific server at a particular point of time.
Avoiding Missing Logs
- When a web server is offline or powered off, log files are not created.
- If the record of hits indicates that the server was online and active at the time that log file data is missing, the administrator knows that the missing log file might have been deleted.
- To address this issue, an administrator can schedule a few hits to the server using a scheduling tool and then keep a log of the outcomes of these hits to determine when the server was active.
- When a log file is missing, it is difficult to know if the server was offline or powered off, or if the log file was deleted.
Implement Log Management
- Log management is the process of dealing with large amounts of system generated logs and records.
- It includes all the processes and techniques used to collect, aggregate, analyze, and report the computer-generated log messages.
- Log management infrastructure consists of the hardware, software, networks, and media used to generate, transmit, store, analyze, and dispose of log data.
- Log management infrastructure typically comprises the following three tiers:
- Log generation
- Log analysis and storage
- Log monitoring
Functions of Log Management Infrastructure
General
- Log parsing
- Event filtering
- Event aggregation
Analysis
- Event correlation
- Log viewing
- Log reporting
Storage
- Log rotation
- Log archiving and retention
- Log compression
- Log reduction
- Log conversion
- Log normalization
- Log file integrity checking
Disposal
- Log Clearing
Challenges in Log Management
- Potential problems with logs collection due to their diversity and frequency.
- Compromise of confidentiality, integrity, and availability of the logs is often intentional or accidental
- People performing log analysis have lack of formal training and often deprived of proper support
Meeting the Challenges in Log Management
- Requirements: Define requirements and goals for performing log management throughout the organization.
- Approach: Generate policies and procedures for log management to ensure a consistent method.
- Security: Create and maintain infrastructure for secure log management.
- Training: Provide the necessary training to all staff regarding their log management responsibilities.
Centralized Logging
- Centralized logging is defined as gathering the computer system logs for a group of systems in a centralized location.
- It is used to efficiently monitor computer system logs with the frequency required to detect security violations and unusual activity.
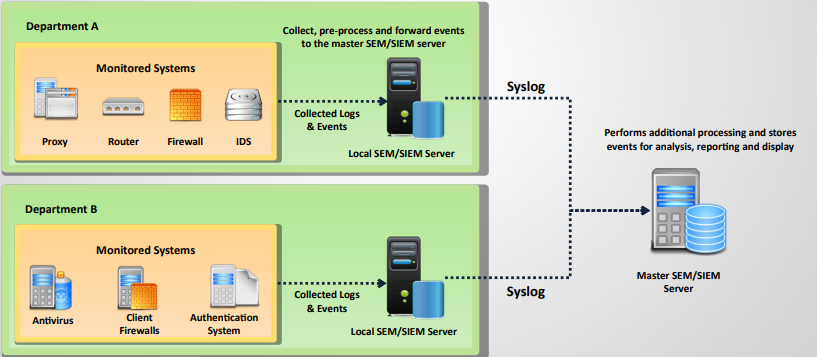
Syslog
- Syslog is a standard; network devices use to forward log messages to a server across an IP network.
- The term syslog refers to both the syslog protocol and the application or library sending syslog messages.
- Syslog sender sends log messages to the syslog receiver, also known as syslogd, syslog daemon or syslog server.
- Syslog uses either TCP or UDP to transfer log messages in a cleartext format.
Fields that are included in the centralized binary log file format:
- Date, Time, Client IP address, Username, Site ID, Server name, Server IP address, Server port, Method, URI stem, URI query, Protocol status, Server IP address, Server port, Method, URI stem, URI query, Protocol status.
Ensure System’s Integrity
- Always stay up to date on service packs and hotfixes to ensure that the system’s files are valid.
- Audit all changes to binary files in Windows System directory.
- If an intruder can modify system files that record log files, then the log files are not valid as evidence.
Control Access to Logs
- To prove the credibility of logs, an investigator or network administrator needs to ensure that any access to those files is audited.
- The investigator or administrator can use NTFS permissions to secure and audit the log files
- Web server needs to be able to write to log files when the logs are open, but no one else should have access to write to these files
- Once a log file is closed, no one should have access to modify the contents of the file.
Verify Log File Authenticity
- An investigator can prove that log files are authentic if he or she can prove that the files have not been altered since they were originally recorded.
- Log files are generally simple text files that are easy to alter. The date and time stamps on these files are also easy to modify. Hence, they cannot be considered authentic in their default state.If a server has been compromised, the investigator should move the logs off the server.
- The logs should be moved to a master server and then moved offline to secondary storage media such as a portable disk.
Use Signatures, Encryption, and Checksums
- The only way to ensure the log file accuracy is to sign and encrypt the log using PGP or some other public-key encryption scheme.
- File signatures are helpful because if a single file is corrupted, it does not invalidate the remaining logs.
- Tools such as Fsum can be used to generate MD5 hashes for the files.
- Store the signatures and hashes with the logs, but also store a secure copy in a different location.
Work with Copies
- When examining log files, an investigator should never work with the original files.
- The investigator should create copies (Seizure & Working) before performing any post processing or log file analysis.
- If the original files are unaltered, the investigator can prove more easily that they are authentic and in their original format.
- When using log files as evidence in court, an investigator is required to present the original files in their original format.
Maintain Chain of Custody
- As with all forensic evidence, log files must be kept in chain of custody.
- When an investigator or a network administrator moves log files from a server to an offline device, they should record where the log file went and which other devices it passed through.
- This can be done using technical or nontechnical methods, such as MD5 authentication.
- An investigator can prove that the log file has not been altered or modified since its capture; if they maintain the chain of custody.
Condensing Log File
- Log files can be sorted by using a syslog, but the output of the syslog contains a large log file.
- The forensic team finds it challenging to locate the crucial log entry.
- Log entries must be filtered as per the requirement.
- Tools that can be used:
- Swatch (https://sourceforge.net/projects/swatch)
- Logcheck (http://logcheck.org)
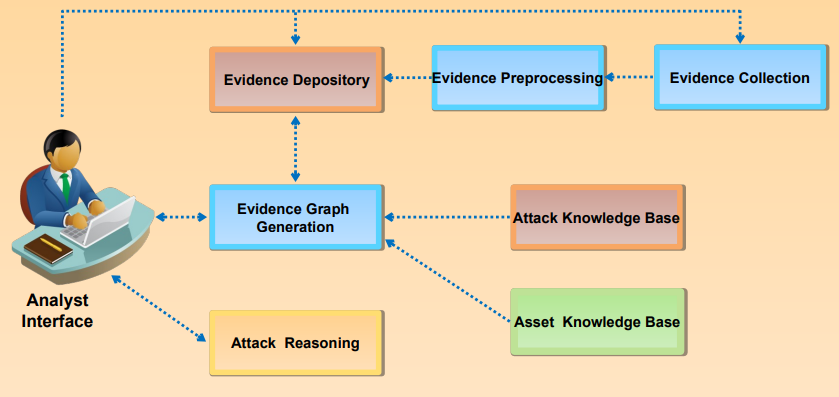
Network Forensics Analysis Mechanism
Log Capturing and Analysis Tools: GFI EventsManager
- It enables to manage event log data for system security, availability, and compliance.
- It enables increased uptime by collecting, normalizing, analyzing, categorizing, and consolidating log data from multiple sources across the network.
Log Capturing and Analysis Tools: EventLog Analyzer
- It allows organizations to automate the process of managing machine generated logs by collecting, analyzing, correlating, searching, reporting, and archiving from single central location.
- Splunk Enterprise
Analyzing Router Logs
- Routers store network connectivity logs with details such as date, time, source and destination IPs and Ports used.
- This information can help investigators in verifying the timestamps of an attack and correlate various events to find the source and destination IP.
- Routers have multiple standards for storing the log details of a network.
The incoming log details are as follows:
- Date and time
- Source IP address
- Source-port
- Destination IP address
- Destination-port
- URL accessed
- URL IP address
- Port Used
Evidence Gathering from ARP Table
- A router’s ARP table is useful for looking into network attacks because it includes IP addresses linked to the corresponding MAC addresses.
- The ARP table maintained on the router is of crucial importance, as it can provide information about the MAC address of all the hosts that were involved in recent communications.
- An investigator can view the ARP table in Windows by running the command arp -a.
Analyzing Router Logs: Cisco
- Cisco routers run on specific operating system, the Cisco IOS.
- The OS has a built-in security manager that defines policies regarding basic logging parameters.
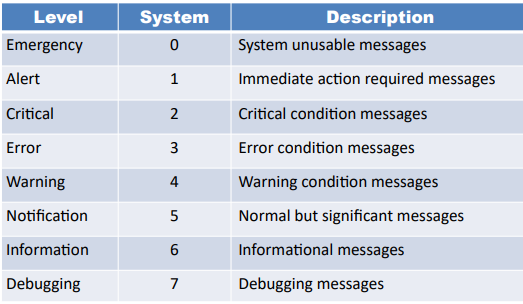
- The router complies with syslog standards to define severity levels using numeric code.
Examining Firewall Logs
- Firewalls serve as a network’s initial point of entry and record information about all data packets entering and leaving the network.
- The network firewall logs collect network traffic data such as request source and destination, ports used, time and date, priority, and more.
- These details will help investigators correlate the data with other suspicious files to find the source and other targets of an attack.
- Network firewalls come with management software that allow users to monitor the logs, control security settings and perform other maintenance tasks over the firewall.
- Investigators need to examine the logs carefully based on the timings and suspicious IP addresses.
- Check for the application generated requests, DNS queries, suspicious IP addresses and URLs
Examine Firewall Logs: Checkpoint
- Checkpoint Firewall logs can be viewed through a Check Point Log viewer that uses icons and colors in the log table to represent various security events and their severity.
- Red represents the connection attempts blocked by firewall in accordance with the security policy or user-defined rules
- Orange signifies traffic detected as suspicious, but accepted by the firewall
- Green color is for the traffic accepted by the firewall
- Icons used in checkpoint logs include:
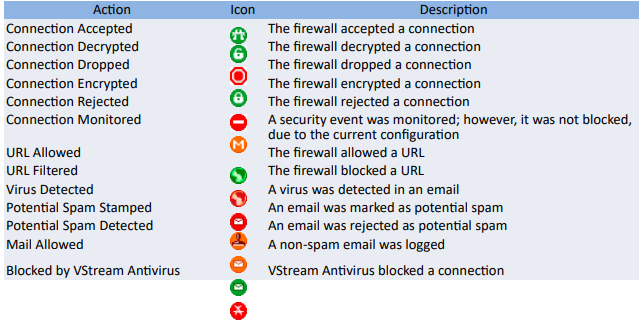
Examine IDS Logs
- IDS Logs provide information helpful in finding suspicious packet types, determining the probes, generating new attack signatures, and calculating attack statistics.
- Most common IDS devices include Juniper and Checkpoint.
- General indicators of intrusion:
- Requests targeted towards known vulnerabilities
- Repeated unusual network activity
- Failure to comply with protocols and syntaxes
- Handling of traffic irregularities
- Unexpected components such as date, time, system resources, etc.
- Occurrence of mistyped command
Examine Honeypot Logs
- Honeypots are the devices that pretend to contain very useful information to lure attackers and find their whereabouts and techniques.
- Kippo is one of the most popular honeypots.
- Logs stored in Kippo contain the following information:
- Timestamp
- Type of session
- Session ID and Source IP address
- Additional information in the message
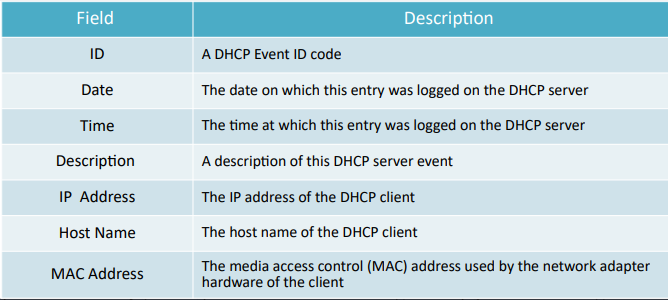
DHCP Logging
- The DHCP logs are saved in the C:\Windows\System32\dhcp folder on DHCP servers
- DHCP server log file format
Evidence Gathering at the DataLink Layer: DHCP Database
- The DHCP database provides a means for determining the MAC address associated with the computer in custody.
- The database can be queried by providing the time duration during which the given IP address accessed the server.
- The DHCP server maintains a list of recent queries along with the MAC address and IP address.
- This database helps DHCP to conclude the MAC address in case DHCP is unable to maintain a permanent log of requests.
ODBC Logging
- Open Database Connectivity (ODBC) logging records a set of data fields in an ODBC-compliant database like Microsoft Access or Microsoft SQL Server.
- With ODBS logging, the administrator must specify both the database to be logged, and set up the database to receive the data
- Some of logged information includes the user’s IP address, user name, request date and time, HTTP status code, bytes received, bytes sent, action performed, and the target file.
- When ODBC logging is enabled, IIS disables the HTTP.sys kernel-mode cache. Because of this, ODBC logging implementation may result in a decrease in overall server performance.
Why Investigate Network Traffic?
Some of the reasons investigators analyze network traffic:
- To locate suspicious network traffic
- To know which network is generating the troublesome traffic and where the traffic is being transmitted to or received from
- To identify network problems
Evidence Gathering via Sniffing
- Administrators should configure sniffers for the size of frames to be captured
- Sniffers collect traffic from the network and transport layers other than the physical and data-link layer
- Spanned ports, hardware taps help sniffing in a switched network
- Sniffer is computer software or hardware that can intercept and log traffic passing over a digital network or part of a network
- Sniffers, which put NICs in promiscuous mode, are used to collect digital evidence at the physical layer
Sniffing Tool: Wireshark
- It enables you to capture and interactively browse the traffic running on a computer network.
- Wireshark uses Winpcap to capture packets, therefore, it can only capture the packets on the networks supported by Winpcap.
- It captures live network traffic from Ethernet, IEEE 802.11, PPP/HDLC, ATM, Bluetooth, USB, Token Ring, Frame Relay, FDDI networks.
- Captured files can be programmatically edited via command-line.
- A set of filters for customized data display can be refined using a display filter.
Sniffing Tool: SteelCentral Packet Analyzer
- SteelCentral Packet Analyzer provides a graphical console for high-speed packet analysis.
Sniffing Tool: Tcpdump/Windump
- TCPdump is a command line interface packet sniffer which runs on Linux and Windows
- TCPDump: Runs on Linux and UNIX systems (tcpdump –i eth0)
- WinDump: Runs on Windows systems (exe)
Packet Sniffing Tool: Capsa Network Analyzer
- Capsa Network Analyzer captures all data transmitted over the network and provides a wide range of analysis statistics in an intuitive and graphical way.
Network Packet Analyzer: OmniPeek Network Analyzer
- OmniPeek sniffer displays a Google Map in the OmniPeek capture window showing the locations of all the public IP addresses of captured packets
- This feature is a great way to monitor the network in real time, and track that traffic
TCP/IP Packet Crafter: Colasoft Packet Builder
- Colasoft Packet Builder allows user to select one from the provided templates: Ethernet Packet, ARP Packet, IP Packet, TCP Packet and UDP Packet, and change the parameters in the decoder editor, hexadecimal editor, or ASCII editor to create a packet
Gathering Evidence from an IDS
- An administrator can configure an IDS to capture network traffic when an alert is generated.
- However, this data is not a sufficient source of evidence because integrity checks cannot be performed on the log files.
- In a network investigation, preserving digital evidence is challenging, as data is displayed on-screen for a few seconds.
- Investigators can record examination results from networking devices like routers, switches, and firewalls using a serial cable and software such as the Windows HyperTerminal program or a script on UNIX.
- If the amount of information to be captured is large, an investigator can record the on-screen event using a video camera or a related software program.
- The disadvantage of this method is that there is no integrity check, making it difficult to authenticate the information.
Documenting the Evidence Gathered on a Network
- Documenting the evidence gathered on a network is simple if the network logs are small, as a printout can be taken and attested.
- Documenting digital evidence on a network becomes more difficult when the evidence is gathered from systems located remotely, because of the unavailability of date and time stamps of the related files.
- If the evidence resides on a remote computer, detailed information regarding collection and location should be documented. The investigator should specify the server containing the data to avoid confusion.
- For documentation and integrity of the document, it is advisable to follow a standard methodology.
- To support the chain of custody, the investigator should print out screenshots of important items and attach a record of actions taken during the collection process.
Evidence Reconstruction for Investigation
Gathering evidence on a network is difficult for the following reasons:
- Evidence is not static and not concentrated at a single point on the network. The variety of hardware and software found on the network makes the evidence-gathering process more difficult.
- Once the evidence is collected, it can be used to reconstruct the crime to produce a clearer picture of the incident and identify the missing links in the picture.
Fundamentals of reconstruction for investigating a crime:
- Temporal analysis: It produces a sequential event trail, which sheds light on important factors such as what happened and who was involved.
- Relational analysis: It correlates the actions of suspect and victim.
- Functional analysis: It provides a description of the possible conditions of a crime. It testifies to the events responsible for a crime in relation to their functionalities.
This article on network forensics is extremely well-written and informative. It explains complex concepts in a simple way, making it easy for beginners and professionals alike to understand how network investigations work.
Thank you so much for your wonderful feedback! 😊 We’re glad to hear that you found the network forensics article informative and easy to understand. Our goal is to simplify complex concepts so both beginners and professionals can gain valuable insights. Stay tuned for more in-depth guides and resources on digital forensics!